Autism Pie Chart
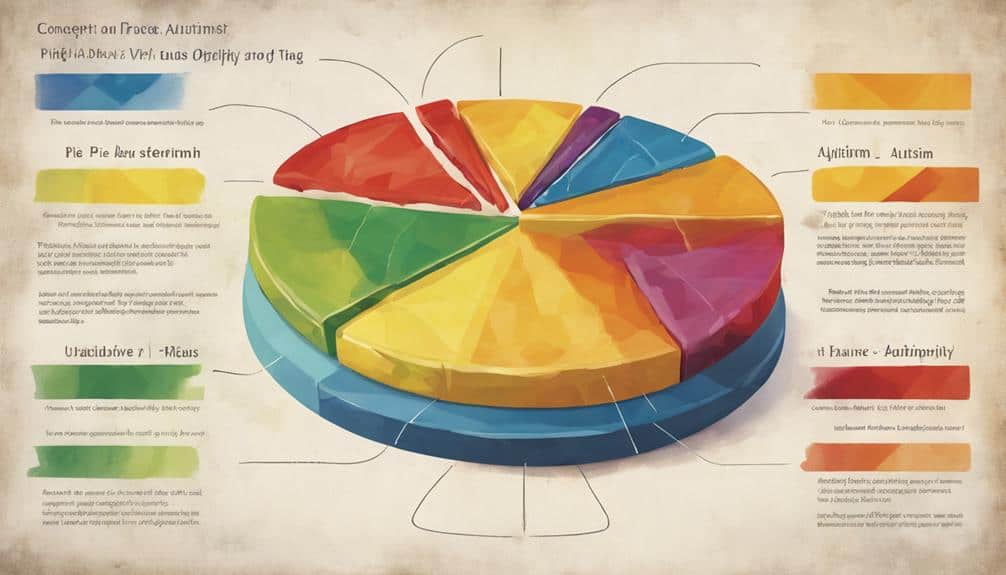
Exploring the intricacies of the autism spectrum through a pie chart is like deciphering a complex puzzle; each slice reveals a different aspect, creating a thorough picture.
However, what truly sets this model apart is its ability to capture the dynamic nature of autism, hinting at the potential for deeper insights into the individual experiences and needs of those on the spectrum.
The pie chart not only categorizes traits but also showcases the interplay between them, paving the way for a more detailed understanding.
Key Takeaways
- Visualizes diverse traits and experiences of autism spectrum
- Challenges traditional functioning labels with dynamic representation
- Emphasizes uniqueness and individuality of each person on the spectrum
- Promotes inclusive understanding and acceptance of autism's complexities
Importance of Data Visualization in Autism

Data visualization plays an essential role in enhancing our understanding of the diverse traits and experiences exhibited by individuals on the autism spectrum, particularly through models like the autism pie chart. The autism pie chart model is a powerful tool that helps represent the complexity and variability of autistic traits in a visually digestible format. By breaking down the spectrum into different segments within the pie chart, it becomes easier to grasp the intricacies of individual autism traits, such as sensory processing differences and communication challenges. This model emphasizes the unique composition of traits that each autistic individual possesses, highlighting the diversity of experience within the autism community.
Through data visualization, we can move beyond simplistic categorizations and appreciate the multifaceted nature of autism spectrum disorder. The pie chart serves as a reminder that autism isn't a monolithic entity but rather a spectrum encompassing a wide range of characteristics and strengths. Understanding this diversity is vital for creating inclusive environments that cater to the specific needs of individuals across the spectrum.
Benefits of Using Pie Charts

Exploring the utilization of pie charts in representing autism traits offers a thorough view of the diverse experiences within the autism spectrum, emphasizing individual uniqueness and the evolving nature of symptoms. Pie charts provide a visual representation that acknowledges the real challenges faced by people with autism. They allow for a more all-encompassing understanding of how symptoms can change and develop over time, moving away from rigid categorizations.
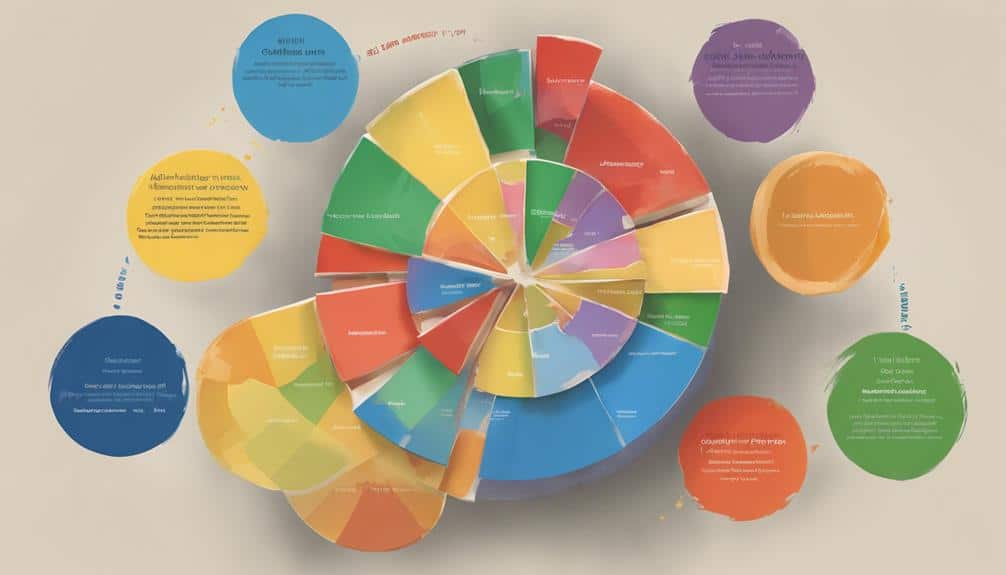
By using the autism wheel model, pie charts show that autism isn't a one-size-fits-all condition, breaking away from traditional functioning labels and promoting acceptance of the spectrum's variability. This visual tool helps in highlighting the complexities of autism diagnosis, especially in cases where co-occurring conditions like intellectual disabilities are present.
The benefits of using pie charts extend beyond data visualization; they offer a more empathetic and all-inclusive perspective on autism, fostering a deeper appreciation for the diverse experiences within the autism community.
Understanding Autism Statistics With Pie Charts

Delving into autism statistics through the lens of pie charts reveals a visual representation of the prevalence and characteristics of Autism Spectrum Disorder (ASD) in a compelling and informative manner. Pie charts offer a clear visual depiction of the distribution of autism symptoms and the varying experiences of children and adults on the spectrum. They help in understanding the following aspects:
- Less Autistic vs. More Autistic: By segmenting the data into categories based on functioning labels, pie charts can show the distribution of individuals who are considered 'less autistic' compared to those who are deemed 'more autistic.'
- Real Challenges: Pie charts can highlight the real challenges faced by individuals with ASD, such as communication difficulties, sensory sensitivities, and social interaction impairments.
- Functioning Labels: Utilizing functioning labels as sections in the pie chart can illustrate the different levels of support needed by individuals on the autism spectrum, ranging from high functioning to low functioning.
Pie charts provide a valuable tool for conveying complex information about autism in a visually digestible format, aiding in raising awareness and promoting understanding.
Enhancing Autism Awareness Through Visual Representation

From the insightful exploration of autism statistics through pie charts, the focus now shifts towards advancing autism awareness through innovative visual representation methods.
Autism comes in every shape and size, reflecting the diverse nature of individuals on the spectrum. Research by van Driel et al. emphasizes the need to move beyond functioning labels and consider the strengths present in each person with autism.
By portraying autism as a spectrum, we can better understand that it encompasses a wide range of abilities and challenges. Utilizing visual tools like interactive graphs can help minimize the focus on deficits and instead highlight the unique qualities that individuals with autism bring to the table.
It's important to promote awareness that goes beyond stereotypes and recognizes the multifaceted nature of autism. By showcasing the variety of ways autism can manifest and the strengths that often accompany it, we can foster greater understanding and much-needed support for autistic individuals.
Utilizing Pie Charts for Autism Advocacy

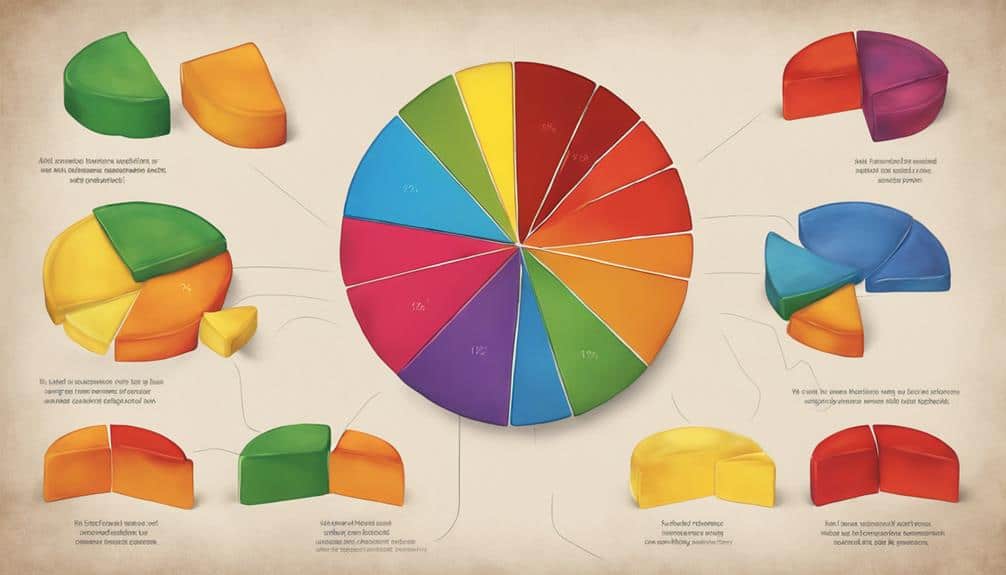
Utilizing pie charts in autism advocacy offers a compelling visual tool to showcase the diverse traits and experiences of individuals on the spectrum. The pie chart represents a simplified view regarding autism traits, highlighting the complexity and uniqueness of each individual.
This visual representation challenges the linear spectrum model, which often overlooks the real challenges and barriers faced by autistic people. By including different sections for various traits, the pie chart emphasizes the dynamic nature of autism symptoms, illustrating that labels and autism levels don't fully capture the richness of the spectrum.
Advocates for autism awareness use pie charts to demonstrate that the real experiences of autistic individuals can't be neatly categorized into predetermined levels, promoting a more inclusive understanding of autism. Through these visual aids, a more nuanced and holistic perspective on autism advocacy is achieved, focusing on the individual rather than fitting into rigid classifications.
Frequently Asked Questions
What Is the Pie Theory of Autism?
The pie theory of autism acknowledges the diverse spectrum of traits encompassing social communication, sensory differences, cognitive flexibility, and executive functioning. It reinforces the importance of early intervention and understanding behavior challenges within the neurodiversity movement.
What Is a Level 1 Mild Autism?
Delving into level 1 mild autism, it encompasses challenges in social nuances and nonverbal cues. While it showcases cognitive strengths and language skills, tailored support through early intervention, behavioral therapies, and educational accommodations is essential.
What Are the 3 Main Symptoms of Autism in Adults?
As an adult with autism, I navigate social difficulties, sensory sensitivities, and communication challenges daily. Repetitive behaviors and routines provide comfort, while executive functioning can be challenging. Managing anxiety, meltdowns, and shutdowns requires constant self-awareness and coping strategies.
What Does High Functioning Autism Feel Like?
Managing high functioning autism feels like constantly interpreting complex social cues, managing sensory overload, struggling with emotional regulation, and facing challenges in communication. It involves intense focus on special interests, rigid routines, and difficulty with change.
Conclusion
To sum up, the Autism Pie Chart model offers a valuable tool for understanding the complexity and diversity of the autism spectrum.
One striking statistic to ponder is that approximately 1 in 59 children in the United States are diagnosed with autism, highlighting the significant impact of this condition on individuals and families.
By embracing visual representation and promoting awareness, we can foster a more inclusive and supportive environment for autistic individuals.


